
Surface Analysis
The methods employed in a successful surface analysis must be tailored to the analytical objective. Please contact us to help you sort through the tools available to meet your analytical objective in the most efficacious manner.
What is Surface Analysis?
Surface analysis is a general description of the study of physical and chemical properties of a material at the outer most “layers”. Depending on the target depth of the analytical needs and the information needed to be gathered will define the best analytical techniques to gather this information. The laboratory scientist must understand the limitations and advantages of each of the techniques to best present valid data and conclusions based on the information gathered.
For the purpose of this discussion we will break this down into the two major informative categories: physical properties and chemical properties. Often several techniques can be used during the same analysis to garner both physical and chemical information, for which we will call “coupled” techniques and will be discussed as well.
Definition of Surface
Often times we must truly focus on what defines the surface depth. As many techniques are capable of generating information at depths into the millimeter range, this is often too deep for the analytical objective. For example, we have a thin film of material on the surface of a steel sample. The film is so thin that it is not even visible under microscopic views. If we utilize a spectroscopic technique of too high of energy, we might yield too much information from the bulk of the sample thus diluting the surface information. This can lead to inconclusive or wrongly conclusive data about the chemical nature of the film.
When defining our surface depth, we will typically talk in units of microns (µm, micrometer or 0.001mm). For defining a surface only a few atomic layers thick we are on the order of 0.001µm. Most ultrathin physical and chemical techniques targeted for this range will have an upper depth range of approximately 0.01µm. As we approach the higher energy chemical techniques, we get into the range of thin films which will have an upper depth range of approximately 1 µm. Finally as we pass the 1 micron depth range we are referring to a “bulk” analysis that, although is being performed at the surface, is yielding information from the bulk material below the surface.
Physical Properties of Surface
The simplest of physical properties observation at the surface is that of appearance. What does this surface look like to the naked eye? For example, we have identified a black “smudge” at the surface of a piece of steel. We note that it is black against the silver background. That in itself is an observation that there is likely a contamination that might be problematic for the application. The simple observation that we can see it indicates that we likely have significant thickness of material that is well beyond 1 um in depth. For those surface artifacts that may not be visible with the naked eye, we will resort to microscopic techniques.
There are numerous microscopic tools available to the scientist, and each tool will have its’ advantages and disadvantages in terms of use. Optical microscopic techniques are very useful in defining surface morphologies and features, however they have limitations in resolving power realistically on the order of about 2000X magnification. At this level of magnification however, a surface feature on the order of 1 micron in size is easily resolvable. For features smaller than 1 micron, we must resort to other imaging techniques such as electron microscopy.
In the case of optical or electron microscopy, we can use the behaviors observed in the imaging to gather information about the surface including morphology, depths of features, size of features and distribution of features, and even somewhat the chemical makeup of those features. The techniques available to utilize for microscopic analysis include:
- Optical Microscopy
- SEM (Scanning Electron Microscopy)
- TEM (Transmission Electron Microscopy)
- STEM (Scanning Transmission Electron Microscopy)
- STM (Scanning Tunneling Microscopy)
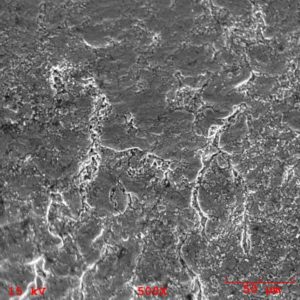
Example SEM image of heat treat scale on 4130 steel surface
In addition to optical and electron microscopy, we can utilize surface interactions with an applied perturbation that can yield spatial or imaging information as well. Imaging of this type is particularly well suited for roughness or z-profile measurements at the surface. These imaging techniques include:
- Interferometry
- AFM (Atomic Force Microscopy)
- SPM (Scanning Probe Microscopy)
Chemical Properties of Surface
In almost all cases of chemical analysis, the electron is our primary friend. At the target surface we can manipulate the electrons that orbit the atoms in such a way as to make that target atom tell us what atom it is.
As we provide an energy source to excite the target atoms, electrons in specific shells will be ejected based on the level of the incident energy. Several conservation mechanisms will then state what can happen to the target atoms as they return to the ground state. The ejected electrons can also interact with their own atoms and lead to additional ejections. In all cases, this is the general description of atomic spectroscopy. Many atomic spectroscopy techniques are also used to provide bulk chemical information, however for surface analysis we must concentrate on atomic spectroscopic techniques with tuned energies that will yield information from the surface or near surface. The atomic spectroscopic techniques that we routinely utilize in the lab to characterize surface and near surface spectroscopic information are listed in order of the least depth to greatest depth.
- SIMS (Secondary Ion Mass Spectroscopy)
- AES (Auger Electron Spectroscopy)
- XPS (X-ray Photoelectron Spectroscopy)
- EMA (Electron Microprobe Analysis)
- WDS (Wavelength Dispersive X-ray Spectroscopy)
- EDS (Energy Dispersive X-ray Spectroscopy)
- XRF (X-ray Fluorescence Spectroscopy)
Now that’s all fine and dandy for the identification of the atoms or elements, but when we need information about particular molecules or the way the atoms combine to form compounds, we must look at molecular spectroscopic techniques. In these instances, we will use incident energies of a level that will induce vibrations in the bonds between the atoms. As these bonds vibrate in different ways we can observe the harmonic frequencies and assign those frequencies to various discrete bonds. Putting all of the bond energies together in a spectrum over the observed frequency range will yield information about the target molecule. The techniques we utilize in the laboratory for molecular spectroscopy include the following:
- FTIR (Fourier Transform Infrared Spectroscopy)
- Raman Spectroscopy
Coupled Techniques
We get the best insight into the observed surface when we can couple both physical properties (spatial information) along with chemical properties. If we can couple both an imaging technique with one or more spectroscopic techniques we can target bulk or very small surface features for chemical identification.
In the lab we routinely utilize equipment with coupled techniques. For instance we will utilize optical microscopy along with FTIR detectors to identify the type of plastic material that is comprising fine particles on a filter pad, or identifying the resin system of different paint layers of a prepared cross-section. Additional we will use SEM coupled with EDS to characterize the elemental identify of a particular inclusion embedded in the surface of an aluminum casting.