Understanding your Parts Cleanliness Report
RTI Laboratories has been offering parts cleanliness testing as a service for well over a decade. Back when we first started offering this service it was mostly in support of assessing background data for automotive powertrain components. As a matter of fact, I think we probably cleaned and assessed every single part number in a certain German OEM diesel engine compartment per the DBL 6516 specification. We utilized cleaning technology still used and specified today, however back then, assessing particle sizes was largely a manual procedure involving isolation of particles on a filter and performing analysis by manually observing and counting particle sizes and composition via the microscopic ocular or image analysis.
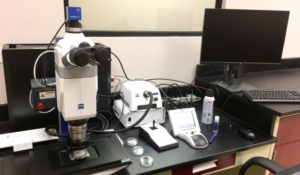
In the early days, the automated imaging systems were available, but the methodologies, software algorithms and hardware were not that good and still required a large amount of interaction to “vet” automated data. In the recent years, however, the technology has advanced from the hardware and software side such that every major microscope manufacturer offers a particle counting and sizing solution; and they are all very good, and rival those solutions offered by the dedicated counting solution manufacturers of the past such as Filtrex (GT Vision) and Jomesa. In addition, we have found that many of the automotive OEM standards currently being supported and written have adopted much more “standard” practices as described in what we feel are the “master” cleanliness specifications of ISO 16232 and VDA 19. We evaluated several solutions for introducing automated sizing and counting solutions to this lab and selected the Zeiss solution for our needs. As a commercial testing lab assessing cleanliness per literally hundreds of specifications, we needed a solution that technologically met the requirements as specified in ISO 16232 and VDA 19, yet was adaptable to the nuances of the other specifications, particularly in reporting. We felt that the Zeiss AxioZoom v16 hardware and AxioVision Particle Analyzer software met our and our customer’s needs perfectly.
What we found in auditing the vast specification library with the reporting options available with the Zeiss solution, was the overwhelming majority of the specifications could be supported with standard ISO 16232 and VDA 19 reporting. That being said, when we perform analysis per other specifications, we include reporting requirements in a “summary page” of our reports and then provide the supplemental background or raw data such that the summary data can be extracted as well as meet the reporting requirements of ISO 16232 and VDA 19.
The object of this article is to help our clients and perspective clients understand the data that is provided in a standard cleanliness report such that compliance with the contracted specifications are extractable from the dataset. buy abilify online no prescription
We will provide sample datasets with a description of the parameters located on the respective pages. Finally we will delve into the reporting detail and nuances of ISO 16232 and VDA 19 such that the “codes” reported have meaning to the reader.
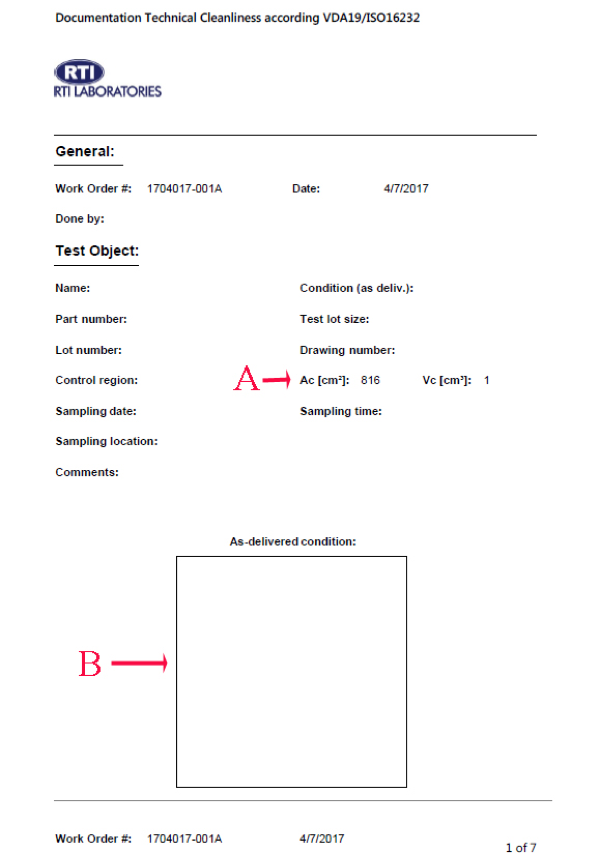
Page 1 of the report shows the information specific to the part being tested. Information provided in location (A) is specific to the normalization of data per either the tested wetted surface area of contact volume. Information provided in location (B) is an image of the tested part if requested.
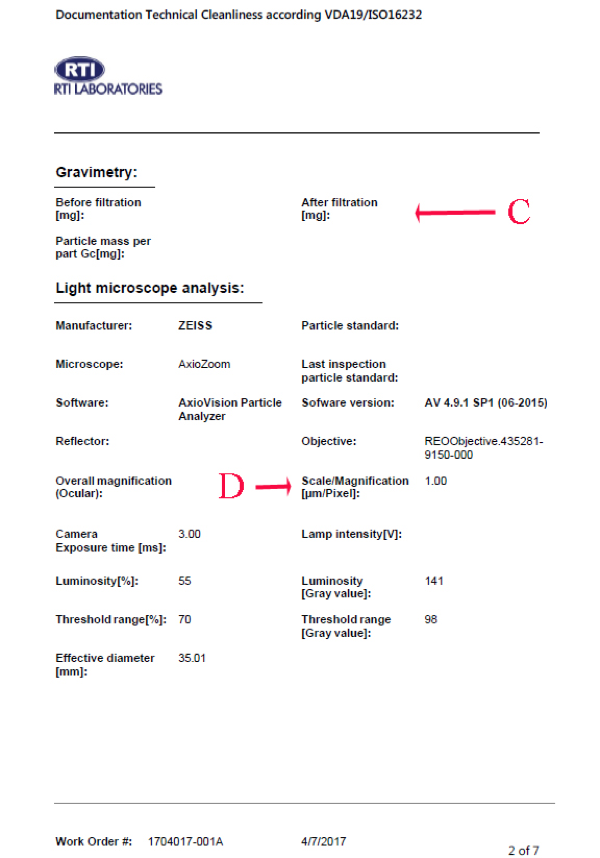
Page 2 of the report shows both the gravimetric data (the mass of the debris removed from the part) as well as the specific conditions governing the light microscopic analysis of the debris field. The information provided at location C) is the filter weight before and after filtration as well as the resulting mass of the isolated particulate. The information provided in location D is critical to determining whether the analysis system meets the technical requirements of ISO 16232 and VDA 19. buy amoxicillin online no prescription
This value must present at 1.00 or lesser for meeting the technical requirements for resolving particles 5 microns or greater (for reporting down to class B).
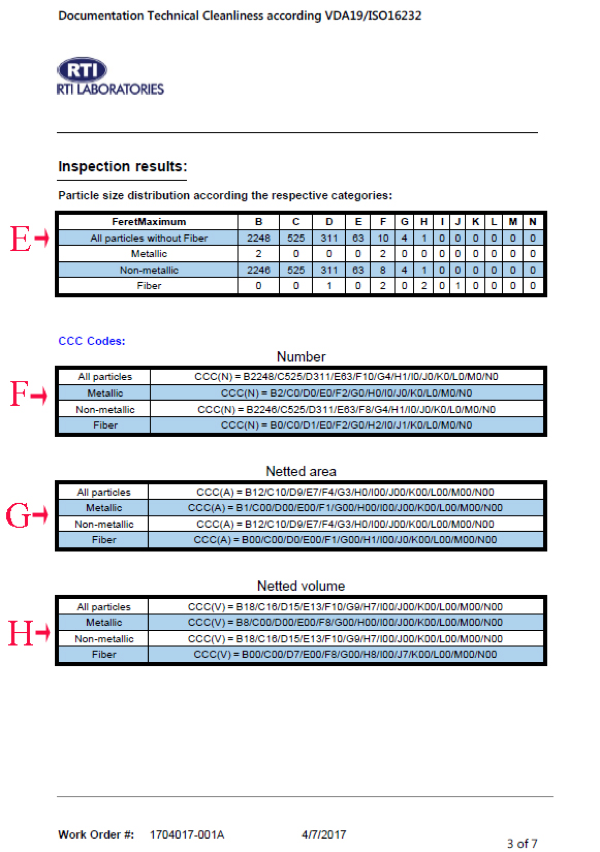
Page 3 of the report details the resulting CCC codes for the analysis performed. Information provided at location (E) is the raw counts determined for each particle class (B through N) and each particle type (metallic, non-metallic, fibers, and total of metallic plus non-metallic). Information provided at location (F) is the CCC code normalized to “per component” for analysis that is specified as CCC=N and where more than 1 component was used in analysis. Note that no particle quantity lookup codes are provided when reporting CCC=N. Information provided at location (G) is the CCC code normalized to 1000cm2 for analysis that is specified as CCC=A and wetted surface area used in analysis is different than 1000cm2. The information provided at location H is the CCC code normalized to 100ml for analysis that is specified as CCC=V and where contained volume used in analysis is different than 100ml.
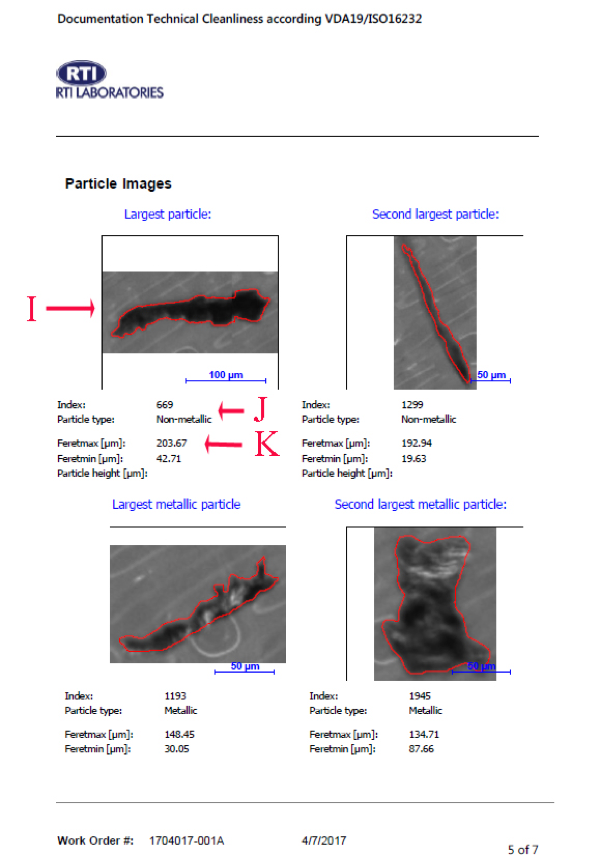
Page 5 of the report starts the image gallery of the largest 2 particles of each particle type identified (specifically non-metallic and metallic). The information provided at locations (I) are the actually magnified images with the outline used for the sizing parameters. The information provided at location (J) is the index number (the particle number as recorded by the database), and the particle type as classified. The information provided at location (K) is the sizing parameters recorded for ferret maximum and ferret minimum. Note that ferret maximum is the parameter used to classify the particle size.
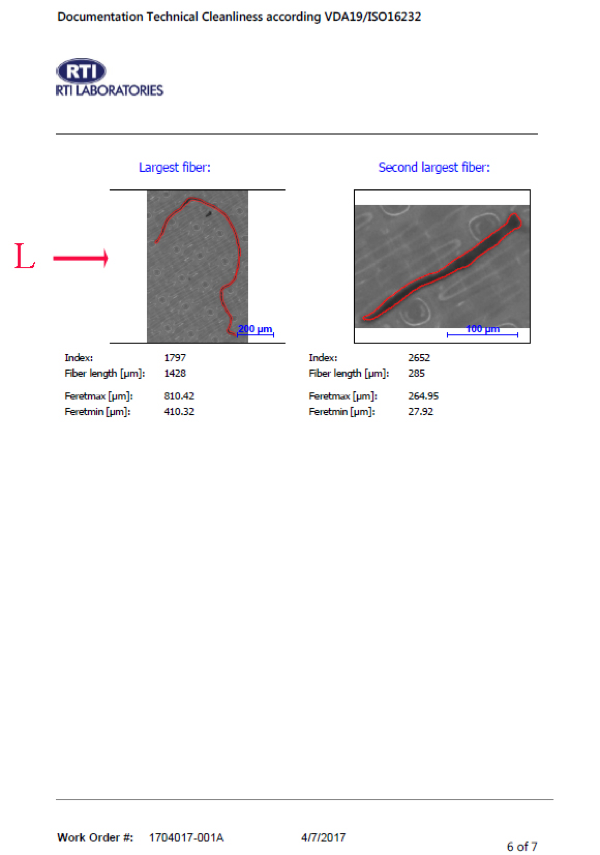
Page 6 of the report is a continuation of the particle gallery for the two largest particles classified as fibers as imaged and shown at location (L).
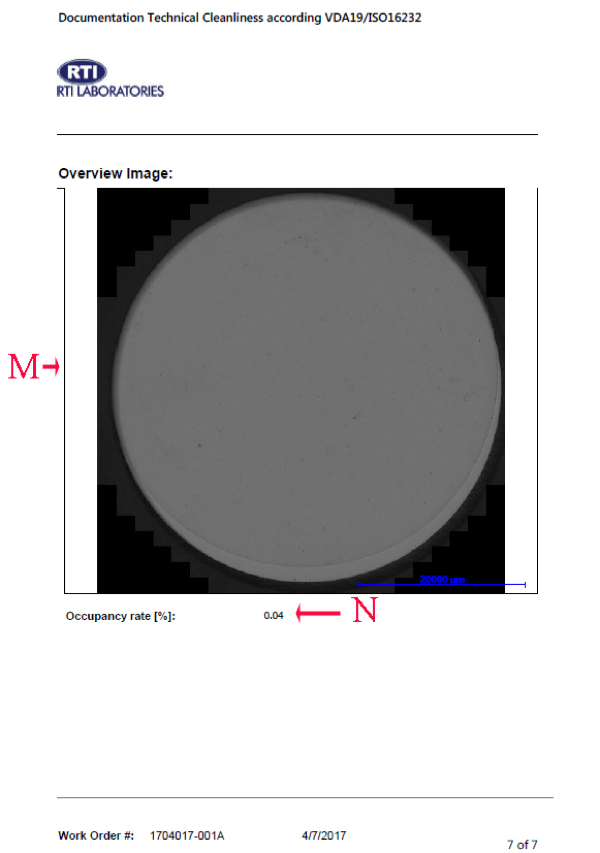
Finally page 7 shows the mosaic constructed image of the entire filter pad analyzed. The image shown at location (M) is the stitch result of over 200 images placed together for the overall analysis. This is a permanent record in the database for any further image analysis that needs to be performed. buy amoxil online no prescription
The information shown at location (N) is the area % occupancy rate of particles versus the filter surface area.
As seen with the CCC codes on page 3, the data is provided as raw counts, results for CCC=N, CCC=A, and CCC=V where applicable. The resulting particle size classes as taken from ISO 16232-10 are provided in the following lookup table:
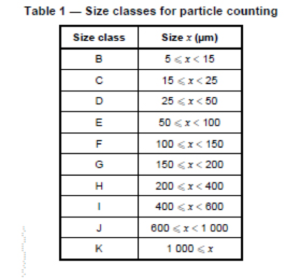
The value following the class letter in the results are the quantity cleanliness levels from the ISO 16232-10 lookup table when reporting CCC=A and CCC=V values. This table is shown below:
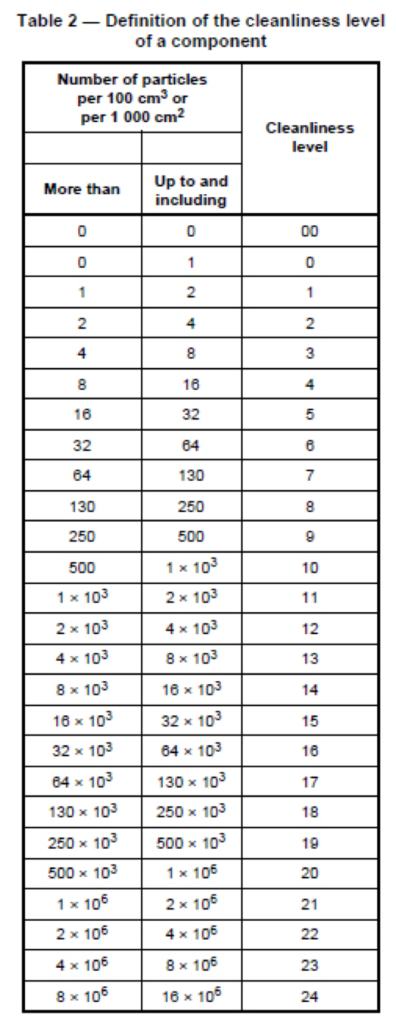
When we use these lookup tables to apply to the data reported on page 3 for a specification that required CCC=A, we get the example as below.
From page 3 or CCC=A report for all particles (not including fibers) is:
CCC(A) = B12/C10/D9/E7/F4/G3/H0/I-N00
Since our analysis was performed on 816 cm2 wetted surface area, the software algorithm has applied a “normalization factor” to the raw particle counts. This normalization factor is x1000/816. The normalization is done and then the normalized values from the lookup tables are applied. So in class B (5-15 microns) we have cleanliness level 12 or between 2000 and 4000 particles. In class C (15-25 microns) we have cleanliness level 10 or between 500 and 1000 particles. In class D (25-50 microns) we have cleanliness level 9 or between 250 and 500 particles. So on and so forth until we hit class I and above (>400 microns) we have 0 particles. Note the difference in cleanliness level 0 (where up to 1 particle is allowed) and cleanliness level 00 (where 0 particles are allowed).
Hopefully the above discussion can help understand the reports as supplied to you. Since information provided is considerably standard and required per ISO 16232 and VDA 19, this discussion may also be helpful in understanding reports obtained from other laboratories as well. However we understand that nuances and specification are dynamic, therefore please contact us with any additional questions.
About the author:
Lloyd Kaufman is the Director of Materials Sciences at RTI Laboratories, and has been performing particle analysis and parts cleanliness testing for a good chunk of 25 years.