
FTIR Analysis
What is FTIR?
Fourier Transform Infrared Spectroscopy, also known as FTIR Analysis or FTIR Spectroscopy, is an analytical technique used to identify organic, polymeric, and, in some cases, inorganic materials. The FTIR analysis method uses infrared light to scan test samples and observe chemical properties.

How does FTIR work?
The FTIR instrument sends infrared radiation of about 10,000 to 100 cm-1 through a sample, with some radiation absorbed and some passed through. The absorbed radiation is converted into rotational and/or vibrational energy by the sample molecules. The resulting signal at the detector presents as a spectrum, typically from 4000 cm-1 to 400cm-1, representing a molecular fingerprint of the sample. Each molecule or chemical structure will produce a unique spectral fingerprint, making FTIR analysis a great tool for chemical identification.

What is FTIR used for?
FTIR spectroscopy is an established technique for quality control when evaluating industrially manufactured material, and can often serve as the first step in the material analysis process. A change in the characteristic pattern of absorption bands clearly indicates a change in the composition of the material or the presence of contamination. If problems with the product are identified by visual inspection, the origin is typically determined by FTIR microanalysis. This technique is useful for analyzing the chemical composition of smaller particles, typically 10 -50 microns, as well as larger areas on the surface.
FTIR analysis is used to:
- Identify and characterize unknown materials (e.g., films, solids, powders, or liquids)
- Identify contamination on or in a material (e.g., particles, fibers, powders, or liquids)
- Identify additives after extraction from a polymer matrix
- Identify oxidation, decomposition, or uncured monomers in failure analysis investigations

FTIR Spectral Interpretation
We have shown that FTIR spectroscopy is a very powerful tool with many applications, however data interpretation is not straightforward. By nature, the total spectrum generated is a series function of absorbed energy response (hence the Fourier Transform portion of the name).
The absorbed bands presented in the spectrum are only somewhat discrete and degenerative. The particular “peak” of energy at a certain wavenumber can move around based on other chemical and matrix factors (as well as by the way the incident energy is introduced). Therefore we do not simply have a “look up” table to say what a particular band of energy will absolutely belong to. The spectrum must be interpreted as a whole system and therefore probably demands the most experienced analysts in all of the spectrographic techniques in correctly characterizing the functionality presented. Yes there are libraries which can yield lookup information but these libraries are limited in scope and depth compared to the millions of industrial chemicals used, and also will not account for mixtures of chemicals which can yield erroneous search information.
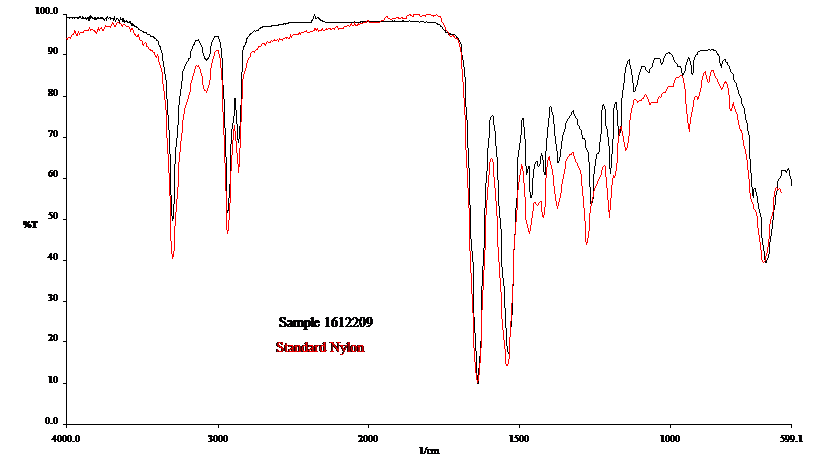
Although typically a qualitative tool for material identification, FTIR analysis can also be used as a quantitative tool to quantify specific functional groups, when the chemistry is understood and standard reference materials are available. The intensity of the absorbance will correlate to the quantity of functionality present in the sample. For instance, we utilize FTIR for quantitative analysis for characterizing the amount of water in an oil sample and the degree of oxidation and nitration of an oil. We have even developed a method for characterizing how paraffinic or naphthenic an oil sample is. It must be noted however that FTIR is a “bulk” analytical technique, in that little information can be gained from trace or small concentrations of material in a sample (typically greater than 5% constituent).
FTIR Sample Introduction Techniques
Proper FTIR analysis is only as good as the ability to introduce and observe the energy from a particular matrix. Fortunately we have many sample preparation and introduction techniques available in the laboratory to properly analyze the sample. In the early days of infrared spectroscopy, the only available method of analysis was transmission. For analysis by transmission, the sample needed to be made translucent to the laser and infrared energy, by directly inserting the sample in the optical path, casting a thin film on a salt crystal, or mixing a powder version of the sample with a salt and casting.
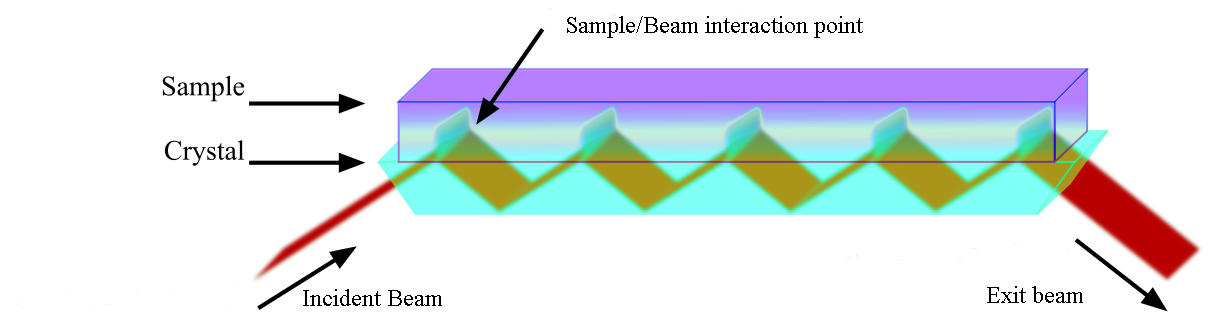
Today, however we have the ability to not only use transmission techniques, but reflectance techniques as well. Because of the ability to focus and manipulate the incident beam with optics, we generally rely on variations of ATR (Attenuated Total Reflectance) techniques to introduce and observe the energy. ATR involves using a phenomenon of internal reflectance to propagate the incident energy. The beam is introduced to a crystal at an incident angle which enables internal reflectance “bounces” at the bottom and top of the crystal before it leaves the crystal on the opposite side. The sample is made to make contact with the crystal at the top such that energy interaction occurs at the crystal and sample interface where the bounce positions are located. Typically the more bounce positions, the larger the energy transfer (and thus better spectral response), however single bounce systems are used when a very small area needs to be analyzed.
For liquid and paste samples we will typically use a HATR (Horizontal Attenuated Total Reflectance) multi bounce technique which will involve placing the sample on a crystal plate or trough in the horizontal position such that gravity acts to make the intimate contact with the cell. Different crystals can be used that will affect the depth of penetration into the sample. For example, we will use a germanium crystal for rubber analysis to limit the effect of highly IR absorbing materials in rubber (namely carbon black), but for normal everyday samples, the zinc selenide crystal is the crystal of choice for durability, resistance to moisture and penetration depth.
When looking to focus the beam to small areas of interest, we will use a micro-ATR accessory on the FTIR bench to focus the beam to a single bounce ATR crystal. With optical observation capability through the ATR cell we can position the sample to make intimate contact with the ATR crystal with the irradiating area occupying approximately 0.2mm in diameter.
When precise positioning is required to characterize a sample area, layer, or micro-fine particle, we move the analysis to a microscopic FTIR system which has positioning resolution on the order of 10 microns in diameter. The microscopic FTIR in the reflectance mode allows us to introduce an ATR probe right at the area of interest using microscopic optics in conjunction with the focused infrared beam. This technique also allows for us to spatially resolve differential chemistry in a very small area.
In addition to the above ATR reflectance techniques, we also have other reflectance techniques such as specular reflectance, which is the measurement of the energy from a true surface reflectance at a single angle of measurement; and diffuse reflectance, which is the measurement of the energy from a true surface reflectance at multiple angles of measurement. Your consulting analyst can advise you on which technique will be most appropriate for your application, matrix, and measurement objective.